Inter-American Development Bank Usability Evaluation
-
Introduction
Brief: Evaluate the usability of the IDB DataGov portal and deliver actionable recommendations.
Challenge: Make complex governance data more accessible for a broad audience.
Goals: Improve site design, affordance, cognitive load, and user feedback.
-
Discovery Phase
Stakeholder interviews: Met with IDB product owners and analysts.
Business requirements: Clear data presentation, smooth comparison flows, and better user guidance.
User needs: Easy navigation, clarity on data meaning, and confidence when comparing indicators.
-
Problem Framing
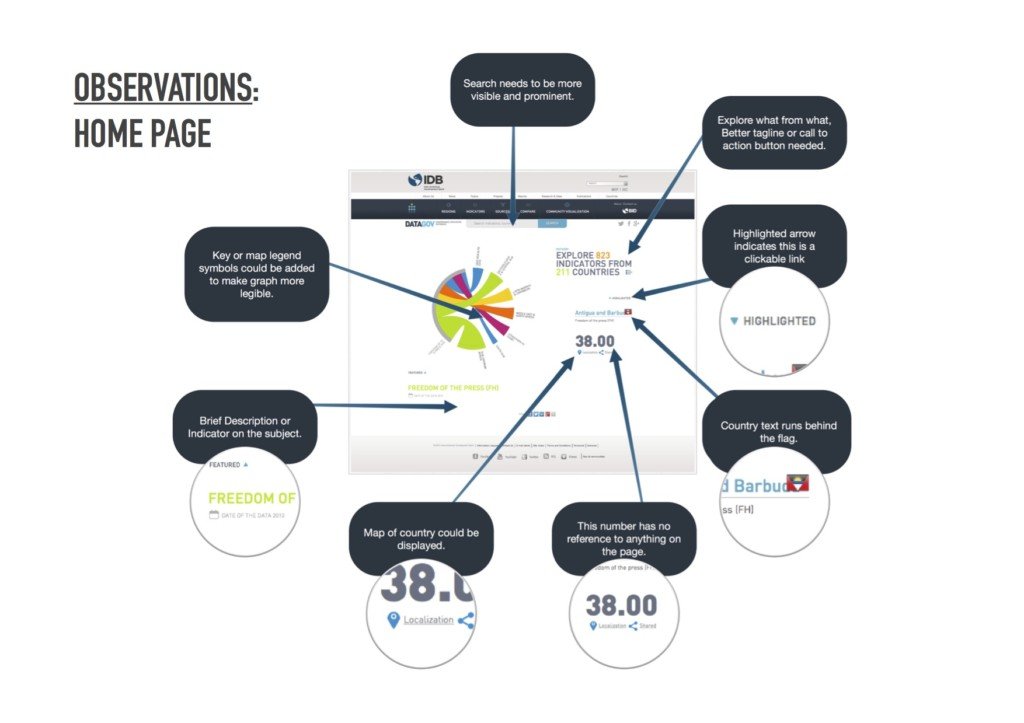
Problem: Users struggled with unclear data descriptions, visual hierarchy, and confusing query processes.
Success: Users can confidently access, interpret, and compare governance indicators.
Constraints: Must work for new and experienced users, no major backend changes.
-
User Research
User interviews: Gathered feedback from both regular and new portal users.
Competitive analysis: Reviewed similar data portals for best practices in data display and comparison flows.
Market research: Found that step-by-step guidance and clear visual cues drive better engagement.
-
Synthesis
Personas: “The Policy Analyst,” “The Occasional Researcher,” and “The Curious Newcomer.”
Journey mapping: From landing on the portal to running a successful data query and interpreting results.
Key insights: Users need better onboarding, clearer process feedback, and more descriptive data labels.
-
Solution Development
Info architecture: Proposed clearer navigation and simplified data comparison paths.
Wireframes & prototypes: Mocked up improved indicator descriptions, step-by-step query flows, and visual hierarchy tweaks.
Visual design: Focused on hierarchy, feedback cues, and consistent labeling.
-
Testing
Usability testing: Ran remote sessions with sample users on prototype flows.
User feedback: Users found the new descriptions and step-by-step process much easier to follow.
Iterations: Tweaked feedback messages and refined visual hierarchy based on input.
-
Implementation
Handoff: Delivered annotated recommendations, wireframes, and a usability checklist to the IDB dev team.
Dev collab: Synced with product and engineering leads for implementation roadmap.
Go-to-market: Recommendations rolled into an upcoming portal update.
-
Results & Impact
Metrics: Fewer support queries, higher successful query rates, and longer session times.
User adoption: Positive feedback from both new and returning users.
Business impact: Improved confidence in the data and smoother research workflows.
Lessons learned: Little things—like better feedback and clearer labels—make a big difference in data-heavy tools.
I was asked to consult on creating a Usability Evaluation of the Inter-American Development Bank (IDB) DataGov. The objective of this study is to generate usability recommendations in the areas of Site Design, Affordance, Cognitive Load and Feedback. The report is divided into five sections, including Executive summary, Purpose of study, Assessment, Usability evaluation checklist, and Conclusion.
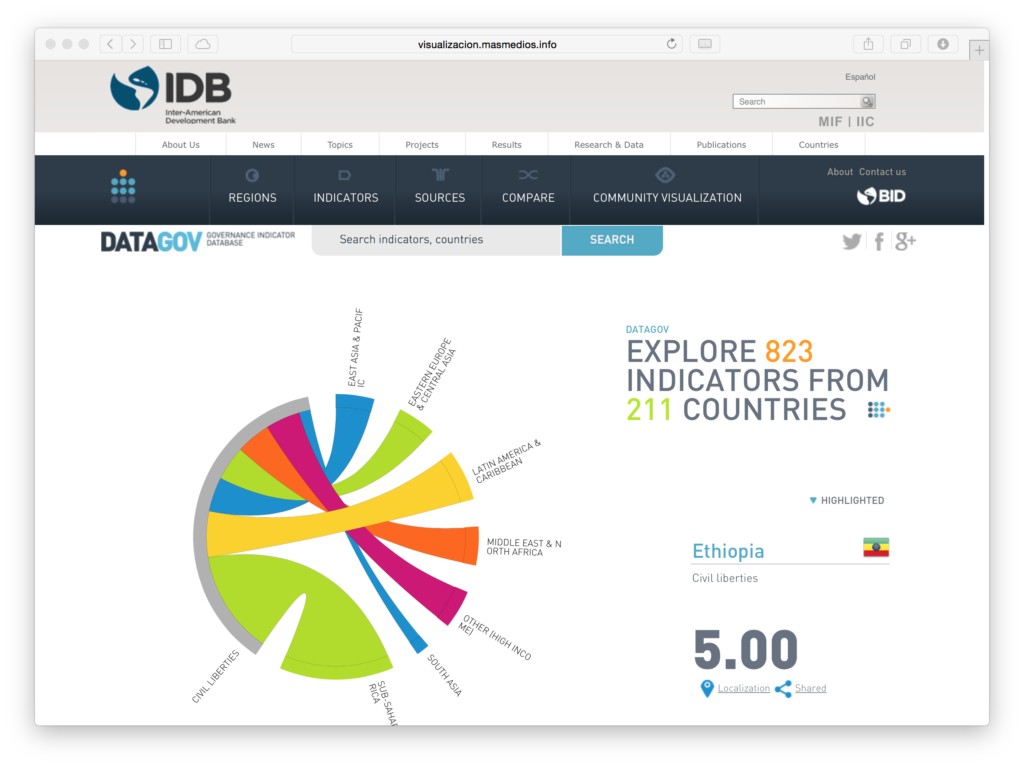
The results showed that tasks in regard to the IDB governance indicators portal are running smoothly in general. Minor areas are recommended for some changes, because of the lack of description on the data being displayed and site visual hierarchy, the inadequate closure and guidance on the process of creating a successful queries for comparison, and the uncertainty on accessing and interpreting the indicator data or compare models for users who were not familiar with the user interface (UI) computing environment.